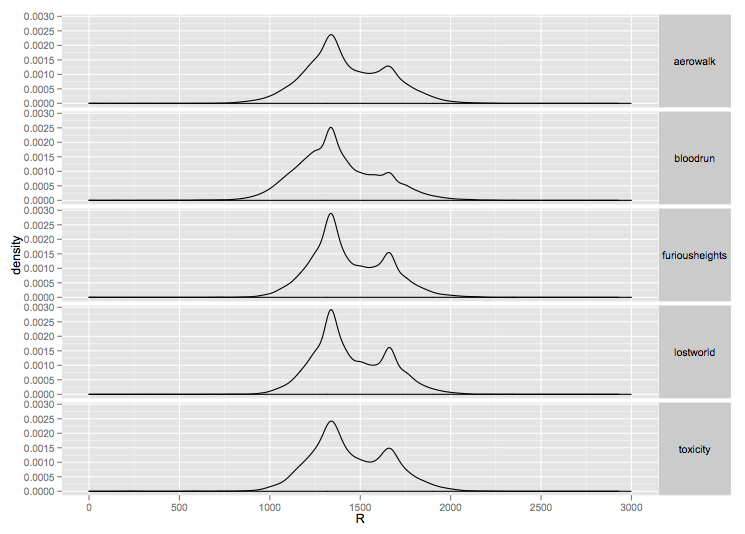
Here is a kernel density plot of duelers on the 5 "main" maps: t7, dm13, tox, aero/hub and ztn. The x axis is the ranking of a player in Glicko2, the y is the density.
There are two interesting developments:
First, I am now ranking players individually on maps. So I know that I, Relativizor is miserable on hub and my best map is dm6 at the moment with ztn a close second. This was started because of something fazz said and I started to wonder about it.
I still don't know very much how I should draw the rankings, but I'll probably just draw it individually for each map.
Second, if you take a look at the above graph, there is a concentration of players around 1700 Glicko (I guess this is around 1500 ELO). This means that there are many players around that rank so it is technically where most of the players are. I don't count the large group who just played duel, lost and never came back. In any case, I found the data interesting. So may you.
12183 Hits